Broadcast Still Leads Live Sports Viewing. The Data Shows Why.
Streaming has changed the way audiences discover and consume video. Live sports, however, continue to behave differently from most other content. Availability, reliability, and simple access matter most when the game is happening in real time.
Date
Author
Tatia O'Connor & Brooke Panepinto Manfredi
Read
15 Min

New findings from the Dynata / TVB 2026 Sports Survey reinforce a clear truth: linear TV still leads sports viewing overall, and broadcast remains the preferred home for many of the biggest and most valuable live moments.
1) Linear TV Still Ranks #1 for Sports Programming
When sports enthusiasts were asked where they watched or listened to sports programming over the past 12 months across any device, Linear TV, including broadcast and cable, ranked first.
Linear TV (Broadcast or Cable): 80%
Streaming networks or services: 76%
Paid subscriptions on sports apps or websites: 32%
Radio (AM/FM or satellite): 32%
Why this matters: Even in a streaming-saturated environment, sports audiences are still most likely to turn to linear TV first. Linear continues to deliver the largest aggregate reach for sports programming.
Source: Dynata / TVB 2026 Sports Survey; N=2,414 (Sports Enthusiasts).
2) The Biggest Sports Drive the Biggest Audiences
Sports enthusiasts reported watching a wide range of leagues, with the highest concentration in top-tier properties:
NFL Football: 88%
NBA Basketball: 68%
MLB Baseball: 62%
NCAA College Football: 57%
NCAA College Basketball: 47%
NHL Hockey: 34%
WNBA: 29%
Golf: 29%
Soccer: 27%
Auto Racing: 24%
Tennis: 20%
Why this matters: These high-reach sports are exactly where broadcast distribution excels. Broadcast delivers mass reach quickly in a live viewing window with minimal friction.
Source: Dynata / TVB 2026 Sports Survey; N=2,414 (Sports Enthusiasts).
3) Linear TV Is the Preferred Way to Watch Major Sports
Across several top sports, linear TV outperforms streaming as the preferred viewing method.
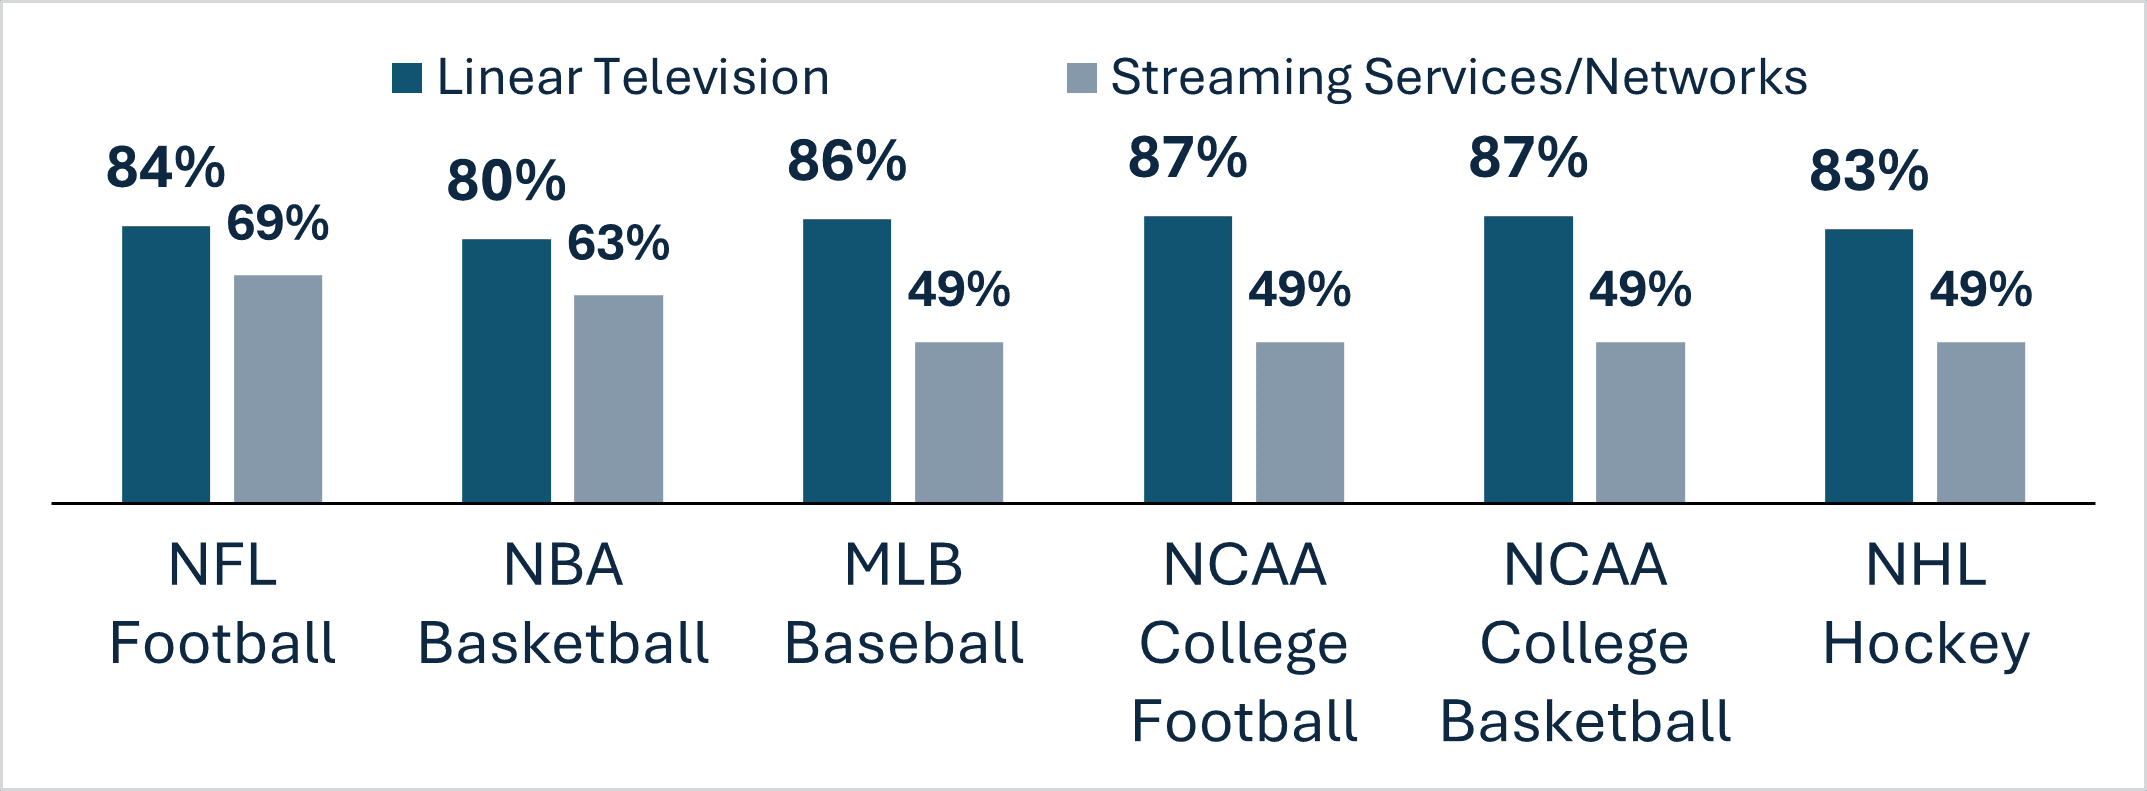
The data shows a double-digit advantage for linear TV across every sport measured. In some cases, including MLB and college sports, linear leads by nearly 40 points.
Why this matters: Streaming is an important part of the modern sports ecosystem. However, when fans are given a choice, linear remains the default platform for watching their favorite sports.
Source: Dynata / TVB 2026 Sports Survey; Sample sizes vary by sport (NFL 2,118; NBA 1,630; MLB 1,499; NCAA FB 1,373; NCAA BB 1,123; NHL 812).
4) Local Availability Matters
One of the strongest signals in the survey is how much fans value local broadcast access.
90% say it is important for their local sports team’s games to be available on their local broadcast TV station
Only 10% say it is not important
Why this matters: Local sports viewing builds habit and community identity. It creates consistent weekly reach that advertisers can plan around. For many viewers, local still means broadcast.
Source: Dynata / TVB 2026 Sports Survey; N=2,414 (Important = very or somewhat important).
5) When Given an Equal Choice, Broadcast Wins for Monday Night Football
Distribution today is often fragmented across platforms. The survey tested a clean scenario: if the number of games were equal across every platform, where would viewers prefer to watch Monday Night Football?
Broadcast TV (ABC or local ABC affiliate): 43%
Streaming (ESPN Unlimited, ESPN Select, Disney+): 29%
Cable TV (ESPN, ESPN2, ESPN Deportes): 28%
Why this matters: When all options are equal, consumers choose broadcast. That preference is clear and measurable.
Source: Dynata / TVB 2026 Sports Survey; N=1,745.
What This Means for Advertisers and Marketers
Building a sports media plan in 2026 is not about choosing broadcast or streaming. It is about using each strategically.
Use broadcast to deliver mass reach quickly, especially during marquee games and major live windows.
Use streaming to extend reach, add flexibility, and capture incremental or targeted audiences.
Protect local availability, because local access continues to drive importance, habit, and consistent viewership.
Sports remains the most powerful live environment in media. Even as viewing options multiply, the data shows that broadcast and linear TV continue to be the foundation fans rely on and prefer when the game is live.
The data is clear. Live sports continue to deliver scale, engagement, and consistency that few other environments can match. If you would like a customized breakdown of how sports programming can work for your business, connect with our team. We will walk you through the numbers and build a strategy aligned with your goals and audience.